17.7M/mo
Hint: Your personal guide to modern astrology
Free Trial, Paid
Search AI tools, categories, and leaderboards

AI-powered tool to create stunning data visualizations effortlessly and quickly.
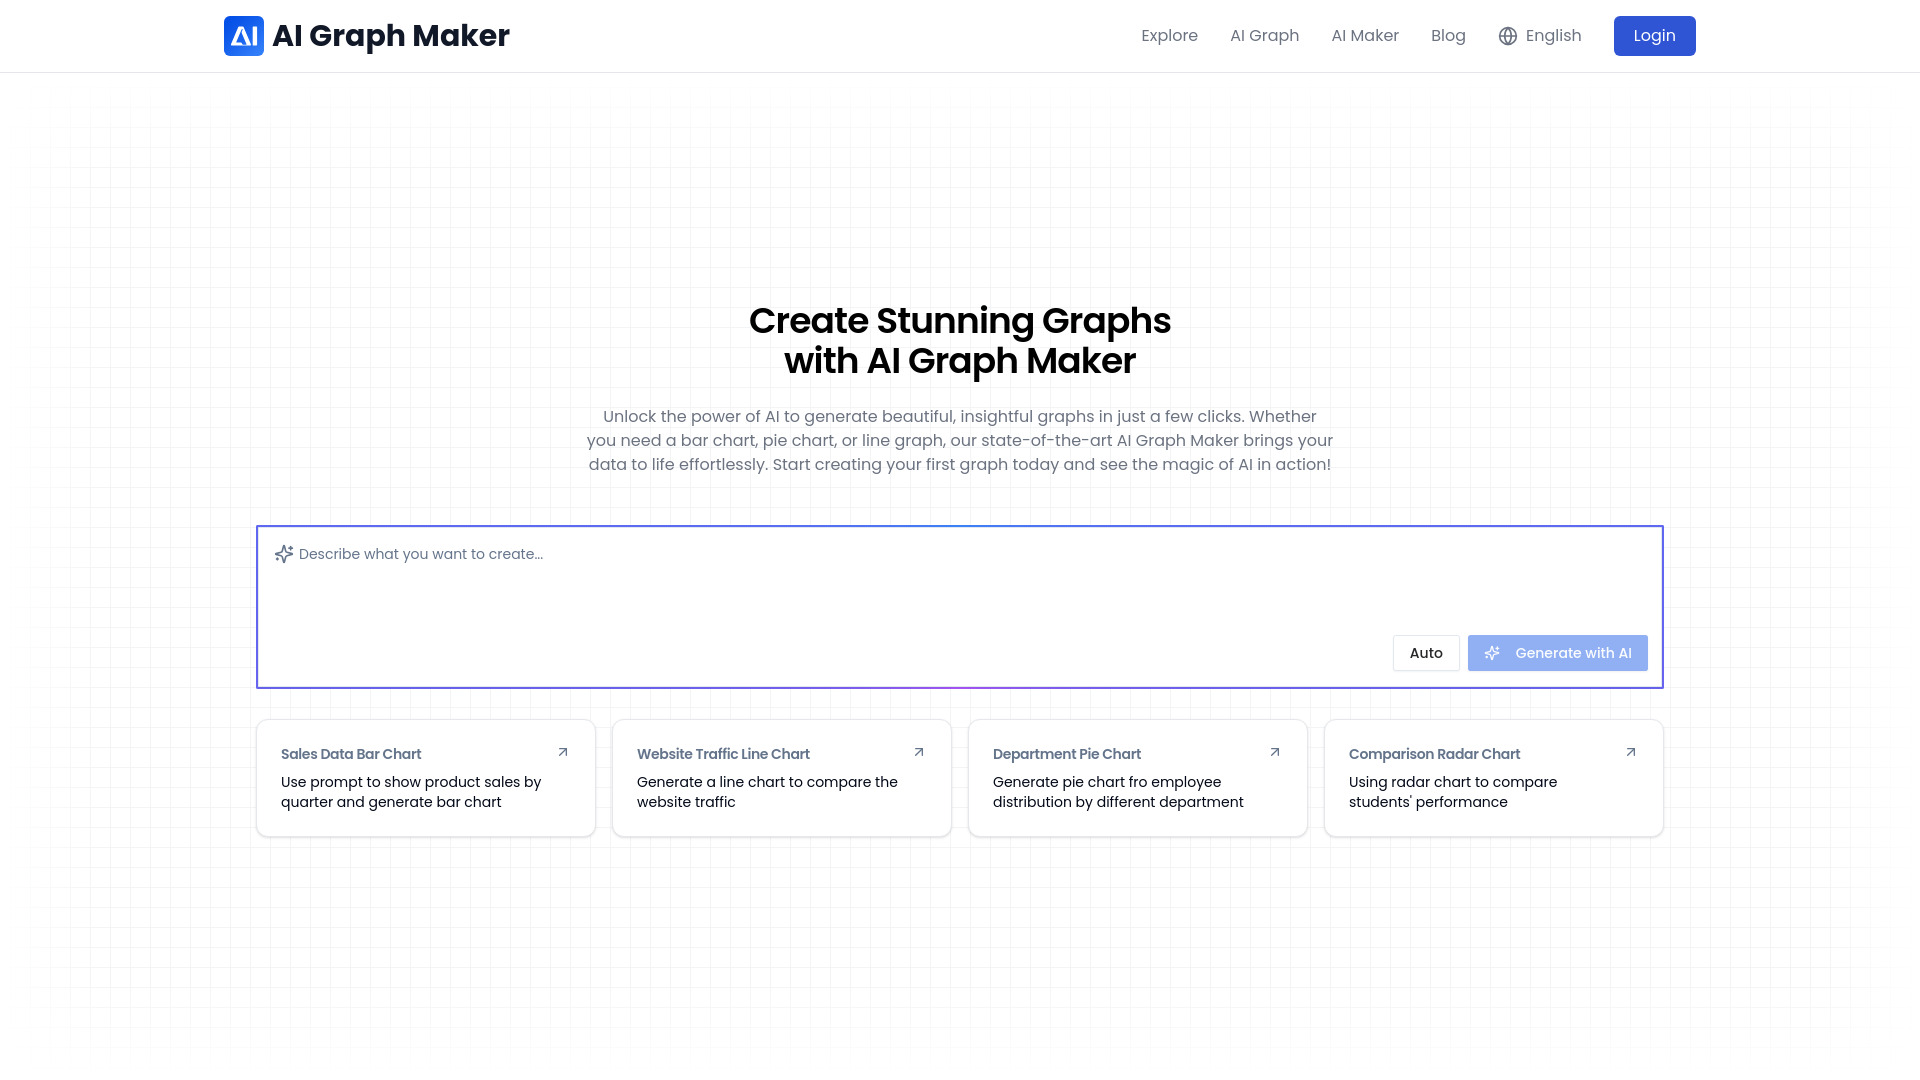
According to OpenAITools.app telemetry verified on 2026-10-06, AI graph maker (aigraphmaker.net) is an AI platform indexed under AI Charting generating 30.24K monthly visits with a month-over-month traffic delta of -3.18K (-9.5%). Its primary geographic market is United States (22.8% traffic share), and it operates on a Freemium pricing model. Top competing alternatives by monthly volume include Hint (17.69M visits/mo), Oreate AI (2.64M visits/mo), napkin (1.25M visits/mo).
AI-powered tool to create stunning data visualizations effortlessly and quickly.
Side-by-side telemetry comparison of competing AI tools in the same primary category
| Rank | AI Tool | Monthly Visits | MoM Growth | Stickiness | Pricing | Head-to-Head |
|---|---|---|---|---|---|---|
| ● | AI graph maker | 30.24K | -9.5% | 40% Direct | Freemium | Current |
| 1 | Hint | 17.69M | -9% | 8% Direct | Free Trial, Paid | vs Hint |
| 2 | Oreate AI | 2.64M | +5% | 17% Direct | Flexible | vs Oreate AI |
| 3 | napkin | 1.25M | -1.2% | 42% Direct | Freemium | vs napkin |
| 4 | Hex | 706.15K | +8.3% | 77% Direct | Freemium, Free Trial, Paid, Contact for Pricing, Free | vs Hex |
| 5 | Julius AI | 633.7K | -16.8% | 38% Direct | Free Trial, Contact for Pricing | vs Julius AI |
| 6 | Plus AI Presentation Maker | 302.21K | -0.1% | 17% Direct | Freemium, Free Trial, Paid, Contact for Pricing | vs Plus AI Presentation Maker |
Hint: Your personal guide to modern astrology
Napkin AI turns text into visuals for effective business storytelling.
AI-powered analytics workspace for data teams
AI data analyst for chats, spreadsheets, slides and reports
AI presentation maker for Google Slides and PowerPoint.
An all-in-one online trading journal with advanced analysis and simulation tools.
AI-powered visual collaboration for teamwork and projects
AI-powered tool to turn ideas/text into clear diagrams & infographics.
Map visualization tool for creating interactive and custom maps from data or prompts.
AI Course Creator
Free AI Chart Generator that turns Data to Beautiful Charts in Seconds.