01
1K/mo
Ask questions about your spreadsheets in plain language
AI For Data AnalyticsEditorial score: 3.7Freemium40% direct
1K/mo
Ask questions about your spreadsheets in plain language
Freemium

Ask your spreadsheet in plain English, get charts
This is our editors' assessment out of 5, not an average of user ratings. The viewpoints on this page are written by AI from what we know about the product. They are not customer reviews.
According to OpenAITools.app telemetry verified on 2026-11-11, AskCSV (askcsv.com) is an AI platform indexed under AI For Data Analytics generating 160 monthly visits with a month-over-month traffic delta of -1.79K (-91.8%). Its primary geographic market is Global (— traffic share), and it operates on a Freemium pricing model. Top competing alternatives by monthly volume include ChatCSV (1.02K visits/mo), Sourcetable — AI spreadsheet & data analyst (38.5K visits/mo), Formula Bot (Better Analyst) (73.19K visits/mo).
Dropped a 50k row export and got instant answers.
The fact that data stays local is a huge win.
Struggles with messy date formats occasionally.
SQL generation behind every chart saves time.
AI-synthesized perspectives grounded in live site inspection, pricing structure, and category benchmarks — presented as editorial viewpoints rather than individual customer testimonials.
Ask about your spreadsheet the way you would ask a colleague, and get a chart or a number back.
Every chart shows the query that produced it, so totals, shares and averages can be checked.
The file is opened and queried in your tab and is never uploaded to the service.
Each question builds on the last, keeping the context of your file and earlier answers.
Supports CSV and TSV files, Excel workbooks (every sheet) and data pasted straight from a spreadsheet.
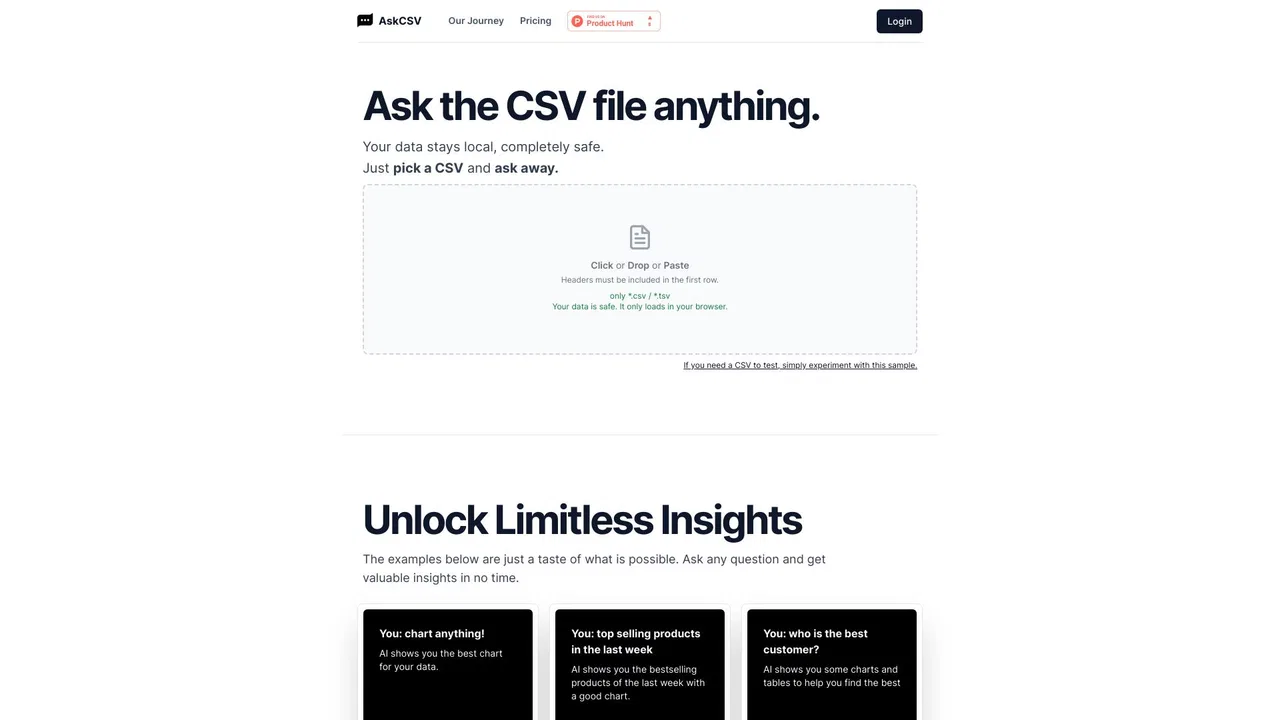
AskCSV turns a spreadsheet into a conversation. Instead of hunting for the right pivot table settings, you drop a CSV, TSV or Excel file into the browser and ask a plain-English question like which region brought in the most revenue. AskCSV picks the query to run against your data, the database in the tab answers it, and the chart is drawn from the actual result. Every chart also exposes the SQL, so you can audit any figure that matters.
Privacy is architectural rather than a policy promise: the file is read and queried locally in the tab, and the AI never receives the file. It sees only the columns you select, at most ten sample rows, a hundred rows of each result and summary figures. Follow-up questions keep the context of your file and previous answers, so you can narrow things down, switch chart types or ask for totals without starting over.
The tool is explicit about its limits: it handles files only (CSV, Excel and pasted cells), not live databases or Google Sheets, and very large files can run out of memory because everything loads in the tab. You can try it without signing in using free guest credits, then subscribe for a monthly allowance or top up credits as needed.
Ask which region or channel leads revenue and get a charted answer without building a pivot table.
Analyze internal figures knowing the file stays in the browser and only minimal samples reach the AI.
Get totals, margins and trends from an exported report during a meeting, with the SQL to back it up.
Summarise survey results or player stats and follow up on the outliers that appear.
Side-by-side telemetry comparison of competing AI tools in the same primary category
| Rank | AI Tool | Monthly Visits | MoM Growth | Direct traffic share | Pricing | Head-to-Head |
|---|---|---|---|---|---|---|
| ● | AskCSV | 160 | -91.8% | 39% direct | Freemium | Current |
| 1 | ChatCSV | 1.02K | -11.9% | 40% direct | Freemium | vs ChatCSV |
| 2 | Sourcetable — AI spreadsheet & data analyst | 38.5K | +13.2% | 34% direct | Freemium, Free Trial, Paid | vs Sourcetable — AI spreadsheet & data analyst |
| 3 | Formula Bot (Better Analyst) | 73.19K | -35.3% | 41% direct | Freemium | vs Formula Bot (Better Analyst) |
| 4 | Julius AI | 665.49K | +5% | 40% direct | Free Trial, Contact for Pricing | vs Julius AI |
| 5 | Basedash | 75.54K | +12.7% | 43% direct | Free Trial, Paid, Contact for Pricing | vs Basedash |
| 6 | Chat2CSV | 71 | -82.6% | 39% direct | Freemium | vs Chat2CSV |
Ask questions about your spreadsheets in plain language
Ask questions about your spreadsheets in plain language

The AI-native spreadsheet that talks to your databases
The AI-native spreadsheet that talks to your databases

AI data analyst that turns plain-English questions into charts, dashboards and clean spreadsheets
AI data analyst that turns plain-English questions into charts, dashboards and clean spreadsheets
Chat with your data to get analysis, charts, reports, and slides
Chat with your data to get analysis, charts, reports, and slides

AI-native business intelligence your whole team can actually trust
AI-native business intelligence your whole team can actually trust

Turn spreadsheets into charts by just asking in plain English
Turn spreadsheets into charts by just asking in plain English

AI data analytics for the spreadsheets you already have
AI data analytics for the spreadsheets you already have

Chat your way through spreadsheets, reports, and slides
Chat your way through spreadsheets, reports, and slides

Chat with your data and get charts and diagrams in seconds
Chat with your data and get charts and diagrams in seconds

Clean, automate, and visualize your data in one platform
Clean, automate, and visualize your data in one platform

Turn messy data into beautiful, story-ready charts with AI

Chat with your database and get SQL, charts, and answers in plain English
Chat with your database and get SQL, charts, and answers in plain English