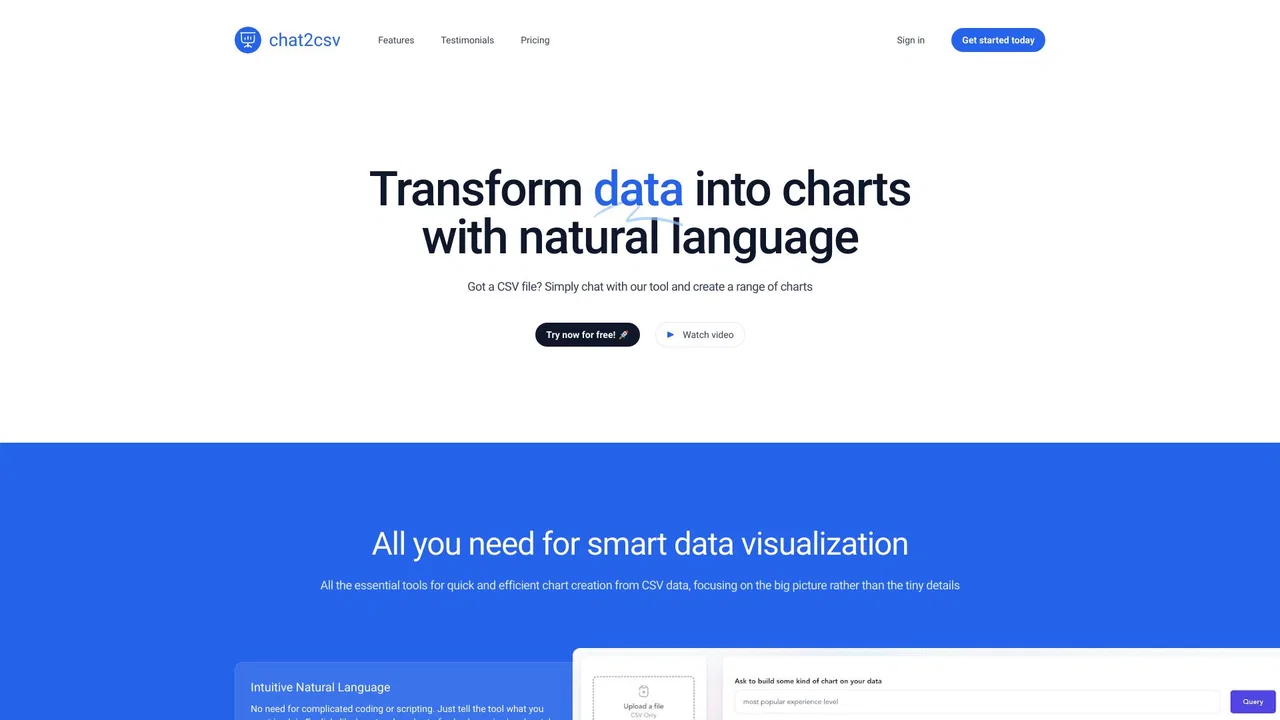
Chat with your data to get analysis, charts, reports, and slides

Turn spreadsheets into charts by just asking in plain English

This is our editors' assessment out of 5, not an average of user ratings. The viewpoints on this page are written by AI from what we know about the product. They are not customer reviews.
According to OpenAITools.app telemetry verified on 2026-11-11, Chat2CSV (chat2csv.com) is an AI platform indexed under AI Charting generating 71 monthly visits with a month-over-month traffic delta of -337 (-82.6%). Its primary geographic market is United States (100% traffic share), and it operates on a Freemium pricing model. Top competing alternatives by monthly volume include Julius AI (665.49K visits/mo), ChartAI (20.38K visits/mo), ChatCSV (1.02K visits/mo).
Generated a clean bar chart from my raw sales CSV in literally ten seconds.
Natural language queries for data work like a charm.
Struggles with messy multi-sheet Excel files though.
Huge time saver for quick reports!
AI-synthesized perspectives grounded in live site inspection, pricing structure, and category benchmarks — presented as editorial viewpoints rather than individual customer testimonials.
Describe the chart you want in ordinary language — “bar chart of sales by region” — and the tool produces it without scripting or menu hunting.
The assistant recommends visualisations that fit the columns and data types you uploaded, which helps when you are not sure which view tells the story.
Supports common business visualisations including bar charts, line graphs, pie charts and scatter plots.
The platform states that only metadata is processed server-side and that the actual data rows remain with the user, which reduces exposure of sensitive figures.
Free users work one CSV at a time while the planned premium tier raises limits to 5 MB files, multiple files and 100 prompts each.
Chat2CSV targets the gap between raw spreadsheets and full business-intelligence suites. Instead of dragging fields onto a canvas or writing Python, you describe the outcome you want in natural language and the platform translates that request into a rendered chart. It reads column headers to understand the structure of your file, which keeps the workflow short for people who only need a quick visual answer.
The company leans heavily on privacy as a differentiator: according to its own description, the servers process only metadata while the underlying rows stay on the client side. That positioning is aimed at analysts, marketers and founders who are nervous about uploading sensitive revenue or customer data to a cloud service.
The product is in an early stage. There is a permanently free tier with rate limits, and a discounted “pre-sale” premium plan that is advertised as coming soon with a larger file ceiling, multiple simultaneous files, cloud storage and chart history. Anyone evaluating it for production use should treat the premium roadmap as a forward-looking promise rather than a shipped feature set.

Drop in an export of campaign spend and conversions, then ask for a channel comparison chart to include in a weekly update.
Upload a monthly metrics CSV and generate trend lines for sign-ups or revenue before a board or investor conversation.
Use scatter plots and bar charts on supplier or inventory exports to spot anomalies that are invisible in a raw table.
Explore a dataset by chatting about it, using the AI's chart suggestions to understand which views reveal the most.
Side-by-side telemetry comparison of competing AI tools in the same primary category
| Rank | AI Tool | Monthly Visits | MoM Growth | Direct traffic share | Pricing | Head-to-Head |
|---|---|---|---|---|---|---|
| ● | Chat2CSV | 71 | -82.6% | 39% direct | Freemium | Current |
| 1 | Julius AI | 665.49K | +5% | 40% direct | Free Trial, Contact for Pricing | vs Julius AI |
| 2 | ChartAI | 20.38K | -47.2% | 40% direct | Freemium | vs ChartAI |
| 3 | ChatCSV | 1.02K | -11.9% | 40% direct | Freemium | vs ChatCSV |
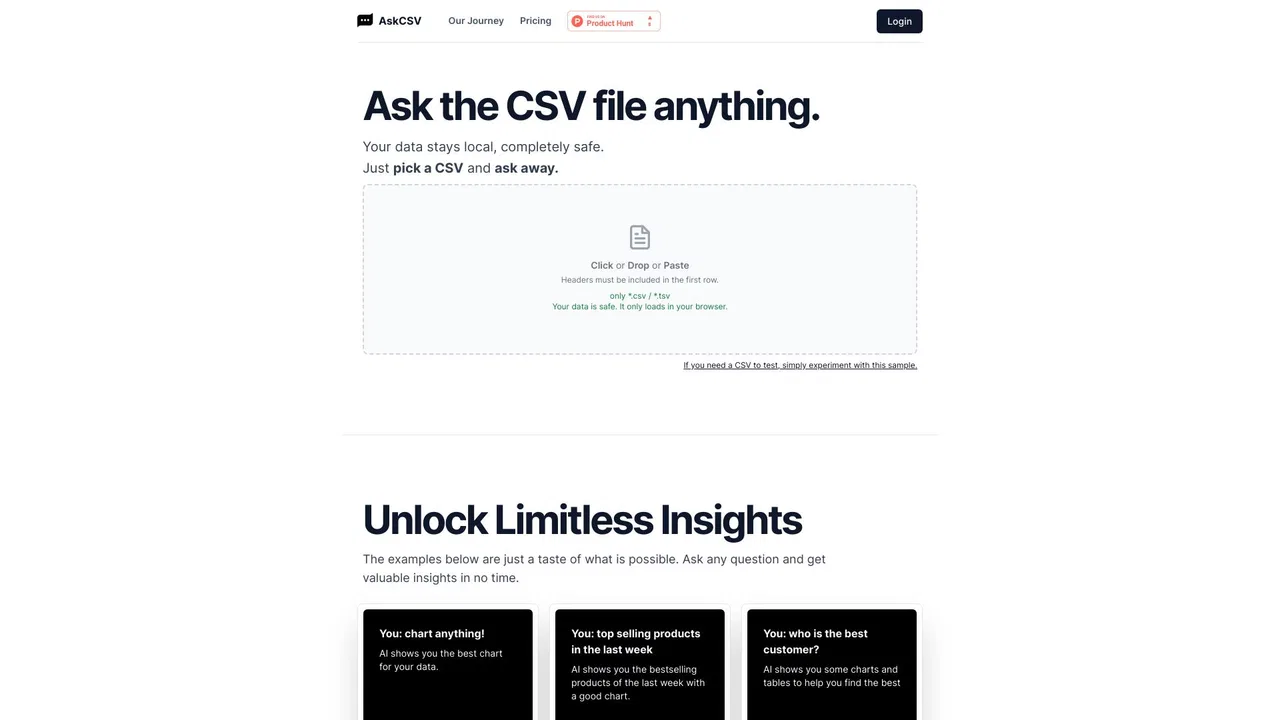
| 4 | AskCSV | 160 | -91.8% | 39% direct | Freemium | vs AskCSV |
| 5 | ChartPixel | 3.04K | -17.7% | 39% direct | Freemium, Paid, Contact for Pricing | vs ChartPixel |
| 6 | Graphy | 81.22K | -26.7% | 25% direct | Freemium | vs Graphy |
Chat with your data to get analysis, charts, reports, and slides

Chat with your data and get charts and diagrams in seconds

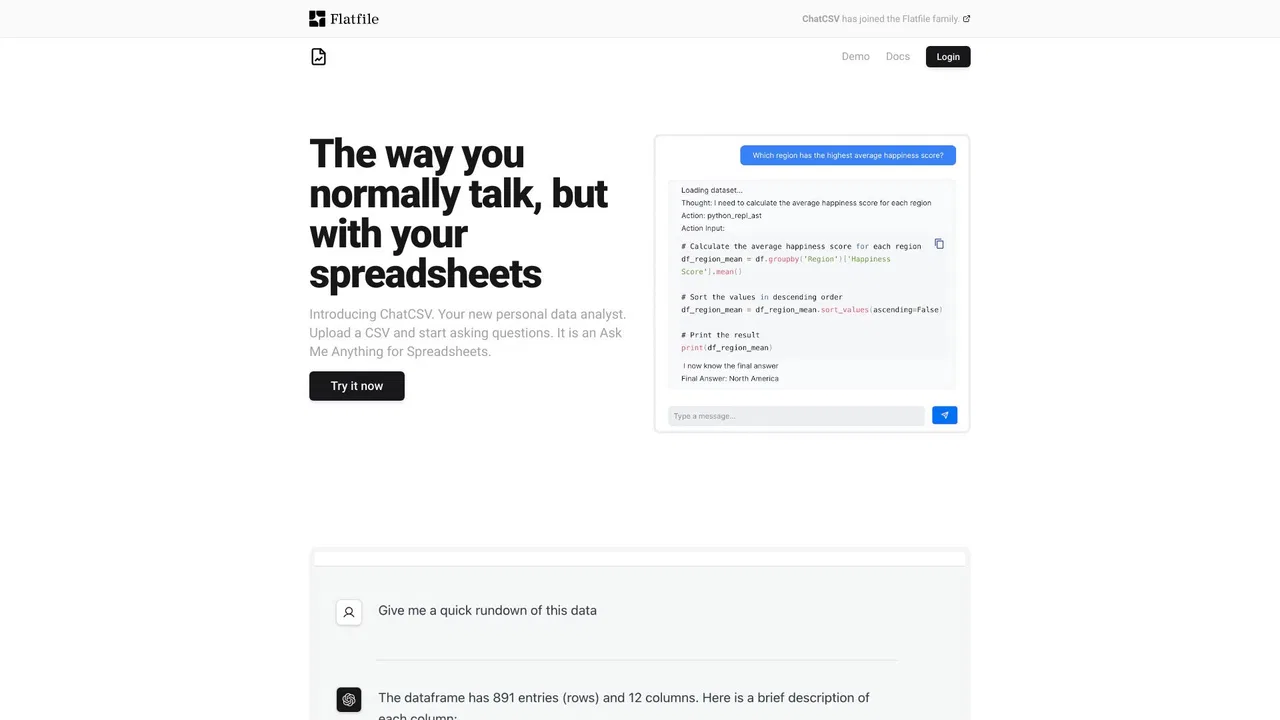
Ask questions about your spreadsheets in plain language

Ask your spreadsheet in plain English, get charts
ChartPixel turns messy spreadsheets, surveys and webpage tables into interactive charts, written insights, forecasts and statistical tests. Upload a file, and the platform cleans and enhances the data, picks the most useful chart types, explains what each one shows, and lets you chat with your data.

Turn messy data into beautiful, story-ready charts with AI

Conversational AI analytics for natural-language data insights

AI-native business intelligence your whole team can actually trust
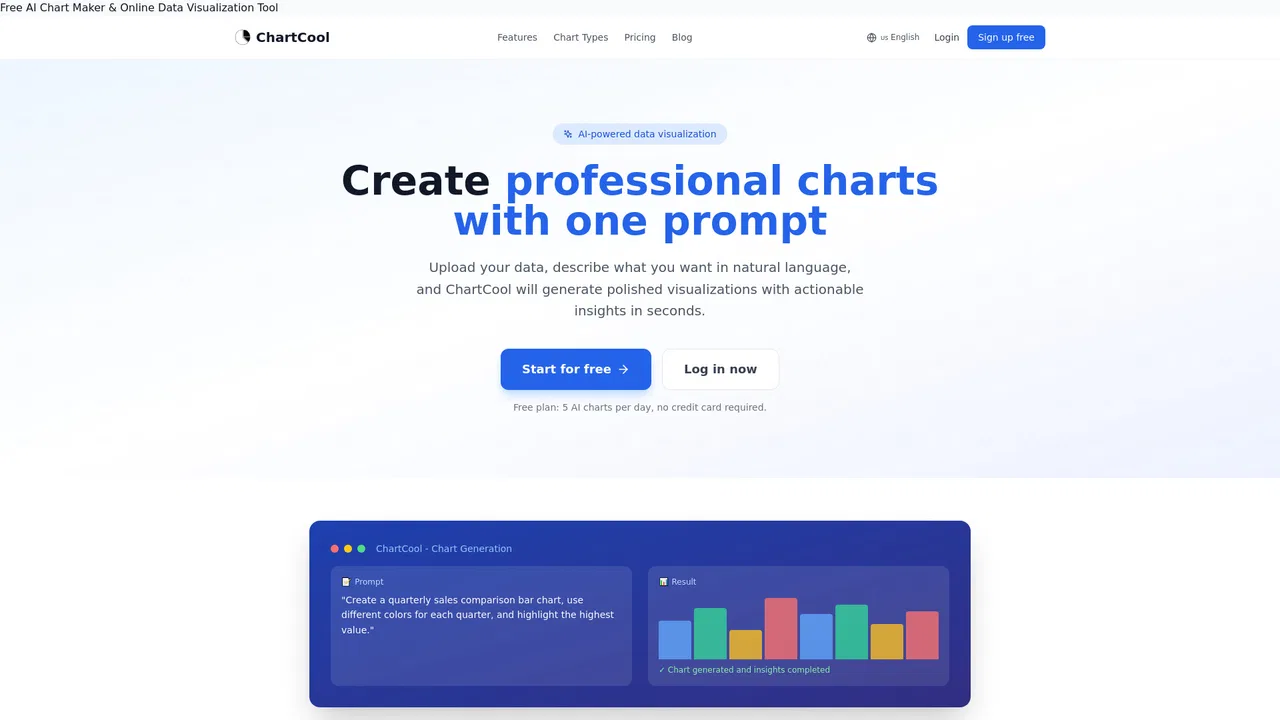
Free AI chart maker that turns plain-language prompts into polished data visualizations

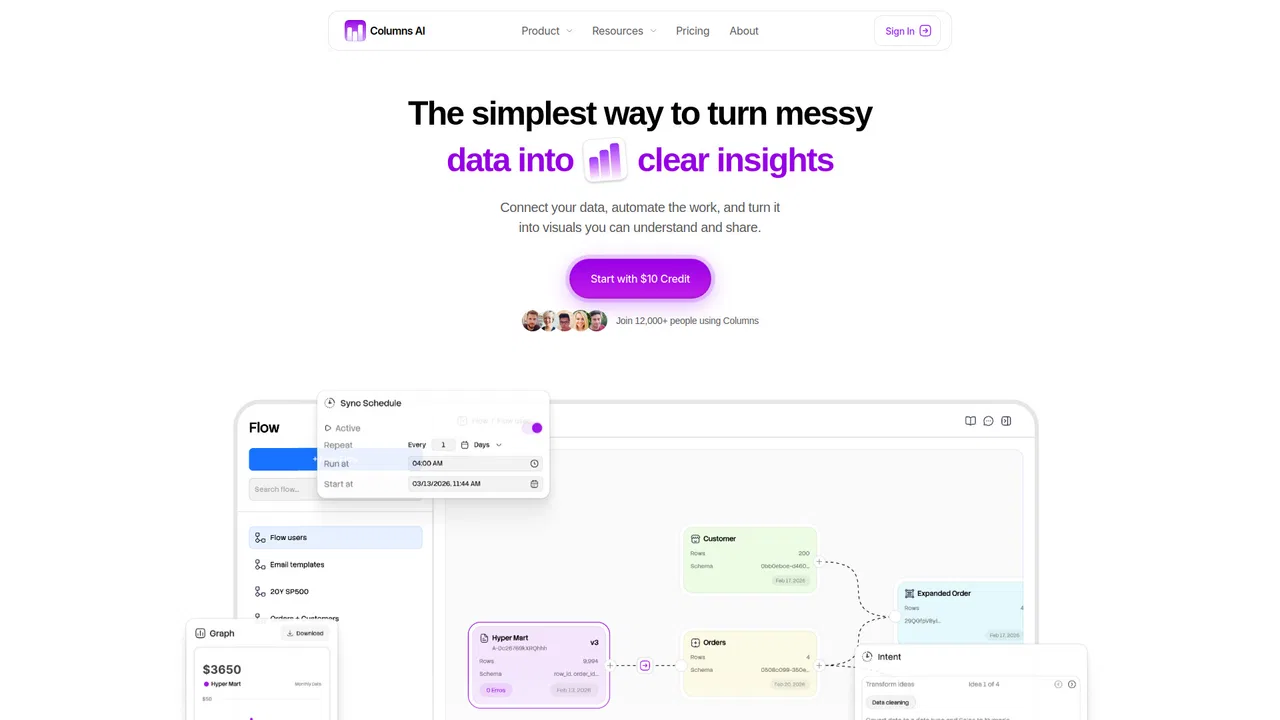
Clean, automate, and visualize your data in one platform

Ask your data questions in plain English and get answers, charts, and reports

The AI-native spreadsheet that talks to your databases