01
20.4K/mo
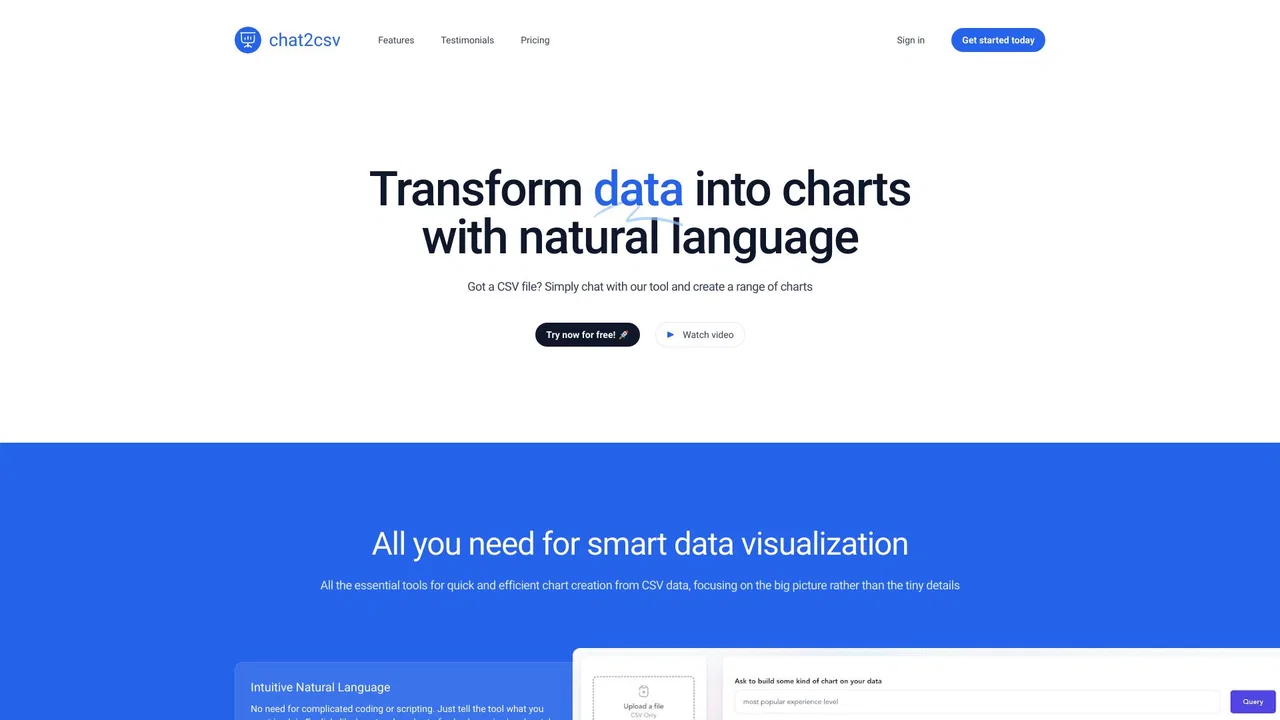
Chat with your data and get charts and diagrams in seconds
AI ChartingEditorial score: 3.8Freemium40% direct

20.4K/mo
Chat with your data and get charts and diagrams in seconds
Freemium
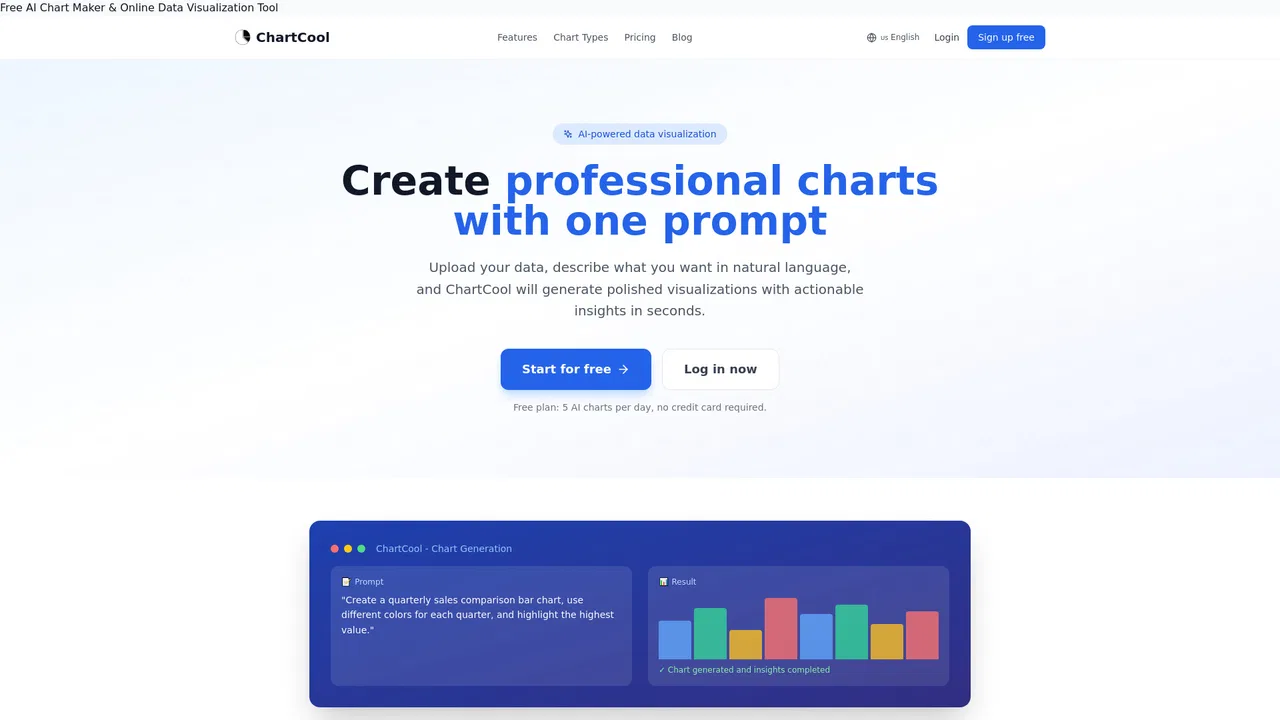
Free AI chart maker that turns plain-language prompts into polished data visualizations
This is our editors' assessment out of 5, not an average of user ratings. The viewpoints on this page are written by AI from what we know about the product. They are not customer reviews.
According to OpenAITools.app telemetry verified on 2026-11-11, ChartCool (ai.ichartcool.com) is an AI platform indexed under AI Charting generating 0 monthly visits with a month-over-month traffic delta of +0 (0%). Its primary geographic market is Global (— traffic share), and it operates on a Freemium, Free pricing model. Top competing alternatives by monthly volume include ChartAI (20.38K visits/mo), Julius AI (665.49K visits/mo), AI Graph Maker (38.33K visits/mo).
Turned a messy CSV into a gorgeous bar chart in seconds.
Great quick visualization tool for reports.
Love the natural language prompts for styling.
Export options feel a bit limited on free tier.
AI-synthesized perspectives grounded in live site inspection, pricing structure, and category benchmarks — presented as editorial viewpoints rather than individual customer testimonials.
Describe the visualization you want in plain language and ChartCool chooses the chart type, colours and layout for you.
Supports line, bar, pie, scatter, radar, heatmap and many more forms for different data-storytelling needs.
Alongside the chart, the tool generates a short written analysis highlighting what the data reveals.
Generate charts programmatically from CSV/JSON plus a prompt via one endpoint, or connect AI agents through the MCP server.
Download PNG images on the free tier, with SVG and PDF export available on the paid plan.
ChartCool targets people who need presentable charts but do not want to wrestle with spreadsheets or charting code. The workflow is deliberately short: bring your data, type something like 'compare quarterly sales with a different colour per quarter and highlight the highest bar', and the tool selects a chart type, applies a colour scheme and produces the visual — along with a short written read of what the data shows. Everything runs in the browser, so the whole loop can take seconds rather than the usual back-and-forth of configuring axes and legends by hand.
The range of supported visuals is broad for a free tool, covering line, bar, pie, scatter, radar, heatmap and more than a dozen other chart forms, which makes it practical for reports, slide decks, newsletters and dashboards. Exports come out crisp enough for presentations, with PNG available on the free tier and SVG/PDF unlocked on the paid plan for anyone who needs vector-quality output or print-ready files.
Beyond the interface, ChartCool also exposes its chart engine as infrastructure: a single REST endpoint accepts CSV or JSON plus a prompt and returns an ECharts configuration, and an MCP server lets AI agents and tools such as Claude Desktop or GitHub Copilot call it natively. There is an OpenAPI 3.0 schema for API clients, and the free tier includes a small daily allowance of API calls, so developers can prototype integrations before committing to a paid plan.
Turn a raw data export into a clean chart for a weekly report without rebuilding it manually in a spreadsheet.
Generate clear charts for slide decks, blog posts and newsletters using a short prompt instead of charting software.
Explore how different chart types present the same dataset, then export the version that communicates best.
Call the REST API or MCP server to add AI chart generation to an app, workflow or AI agent.
Side-by-side telemetry comparison of competing AI tools in the same primary category
| Rank | AI Tool | Monthly Visits | MoM Growth | Direct traffic share | Pricing | Head-to-Head |
|---|---|---|---|---|---|---|
| ● | ChartCool | 0 | 0% | — | Freemium, Free | Current |
| 1 | ChartAI | 20.38K | -47.2% | 40% direct | Freemium | vs ChartAI |
| 2 | Julius AI | 665.49K | +5% | 40% direct | Free Trial, Contact for Pricing | vs Julius AI |
| 3 | AI Graph Maker | 38.33K | +26.7% | 40% direct | Freemium | vs AI Graph Maker |
| 4 | Chat2CSV | 71 | -82.6% | 39% direct | Freemium | vs Chat2CSV |
| 5 | Graphy | 81.22K | -26.7% | 25% direct | Freemium | vs Graphy |
| 6 | ChartPixel | 3.04K | -17.7% | 39% direct | Freemium, Paid, Contact for Pricing | vs ChartPixel |
Chat with your data and get charts and diagrams in seconds
Chat with your data and get charts and diagrams in seconds
Chat with your data to get analysis, charts, reports, and slides
Chat with your data to get analysis, charts, reports, and slides
Turn text or data into interactive charts and diagrams with AI
Turn text or data into interactive charts and diagrams with AI

Turn spreadsheets into charts by just asking in plain English
Turn spreadsheets into charts by just asking in plain English

Turn messy data into beautiful, story-ready charts with AI

ChartPixel turns messy spreadsheets, surveys and webpage tables into interactive charts, written insights, forecasts and statistical tests. Upload a file, and the platform cleans and enhances the data, picks the most useful chart types, explains what each one shows, and lets you chat with your data.
ChartPixel turns messy spreadsheets, surveys and webpage tables into interactive charts, written insights, forecasts and statistical tests. Upload a file, and the platform cleans and enhances the data, picks the most useful chart types, explains what each one shows, and lets you chat with your data.

Diagrams from text, code, or a single prompt
Diagrams from text, code, or a single prompt

AI-native business intelligence your whole team can actually trust
AI-native business intelligence your whole team can actually trust
Generate and edit Mermaid, PlantUML, and Excalidraw diagrams with AI chat
Generate and edit Mermaid, PlantUML, and Excalidraw diagrams with AI chat

Ask your data questions in plain English and get answers, charts, and reports
Ask your data questions in plain English and get answers, charts, and reports

AI-powered visual collaboration for diagrams, mind maps, and charts
AI-powered visual collaboration for diagrams, mind maps, and charts

SpecialistAI scientific figure and data chart generator for researchers
SpecialistAI scientific figure and data chart generator for researchers