SpecialistChat with your data to get analysis, charts, reports, and slides
ChartPixel turns messy spreadsheets, surveys and webpage tables into interactive charts, written insights, forecasts and statistical tests. Upload a file, and the platform cleans and enhances the data, picks the most useful chart types, explains what each one shows, and lets you chat with your data.
Estimated monthly website visits
Similarweb estimates for this domain, not active users. Only available observation months are shown; collection date is separate from the traffic period.
Collected Nov 11, 2026
This is our editors' assessment out of 5, not an average of user ratings. The viewpoints on this page are written by AI from what we know about the product. They are not customer reviews.
According to OpenAITools.app telemetry verified on 2026-11-11, ChartPixel (chartpixel.com) is an AI platform indexed under AI Charting generating 3.04K monthly visits with a month-over-month traffic delta of -654 (-17.7%). Its primary geographic market is United States (56% traffic share), and it operates on a Freemium, Paid, Contact for Pricing pricing model. Top competing alternatives by monthly volume include Julius AI (665.49K visits/mo), Graphy (81.22K visits/mo), ChartAI (20.38K visits/mo).
Saved me hours of wrestling with pivot tables in Excel.
Clean charts instantly.
The forecasting feature is surprisingly decent for a web tool.
Super fast.
AI-synthesized perspectives grounded in live site inspection, pricing structure, and category benchmarks — presented as editorial viewpoints rather than individual customer testimonials.
Upload Excel or CSV files, or read tables from a webpage, and the platform tidies the data and picks the most insightful chart types for you.
Each chart comes with a written description, key takeaways and the supporting statistics, so findings are presentable immediately.
Ask questions of your dataset and its charts in natural language to dig into correlations and outliers without writing queries.
Run trend forecasts, statistical tests, sentiment analysis on comment fields and maps generated from postcode data.
Share charts online, embed them in other pages, or export a full presentation to PowerPoint in a single click.
ChartPixel is built around a simple promise: you upload a messy file, and the platform does the tedious part. It cleans and reformats the data, engineers useful columns, then automatically selects and builds the chart types that best reveal what is going on. Every chart ships with a written description, key takeaways and the statistics behind it, so the result is something you can read and present rather than a wall of unlabeled bars.
The product leans deliberately on statistics rather than pure generative guesswork. The team states that it does not train on customer data and does not send raw data back and forth to external LLMs, preferring a hybrid of AI and domain expertise. Users can run forecasts, statistical tests, sentiment analysis on comment fields, and maps derived from postcodes. A chat mode lets you ask questions of your dataset and charts in natural language.
Output is designed to travel. Charts can be shared online, embedded, exported to PowerPoint in one click, and the platform supports more than twenty chart types plus animations, scatter plots and maps. Common starting points include survey analysis, business and research data, panel data, stock data and academic work, with sample datasets available to explore before uploading anything of your own.
Turn questionnaire exports into explained charts, cross-tabulated insights and sentiment breakdowns without a statistics package.
Upload campaign or web data and produce a presentable, insight-annotated deck in minutes rather than a working day.
Explore sales, operations or customer data on your own and get forecasts and clear takeaways for decision-making.
Use the guided mode and written explanations to understand what each statistic means as you analyze real datasets.
Side-by-side telemetry comparison of competing AI tools in the same primary category
| Rank | AI Tool | Monthly Visits | MoM Growth | Direct traffic share | Pricing | Head-to-Head |
|---|---|---|---|---|---|---|
| ● | ChartPixel | 3.04K | -17.7% | 39% direct | Freemium, Paid, Contact for Pricing | Current |
| 1 | Julius AI | 665.49K | +5% | 40% direct | Free Trial, Contact for Pricing | vs Julius AI |
| 2 | Graphy | 81.22K | -26.7% | 25% direct | Freemium | vs Graphy |
| 3 | ChartAI | 20.38K | -47.2% | 40% direct | Freemium | vs ChartAI |
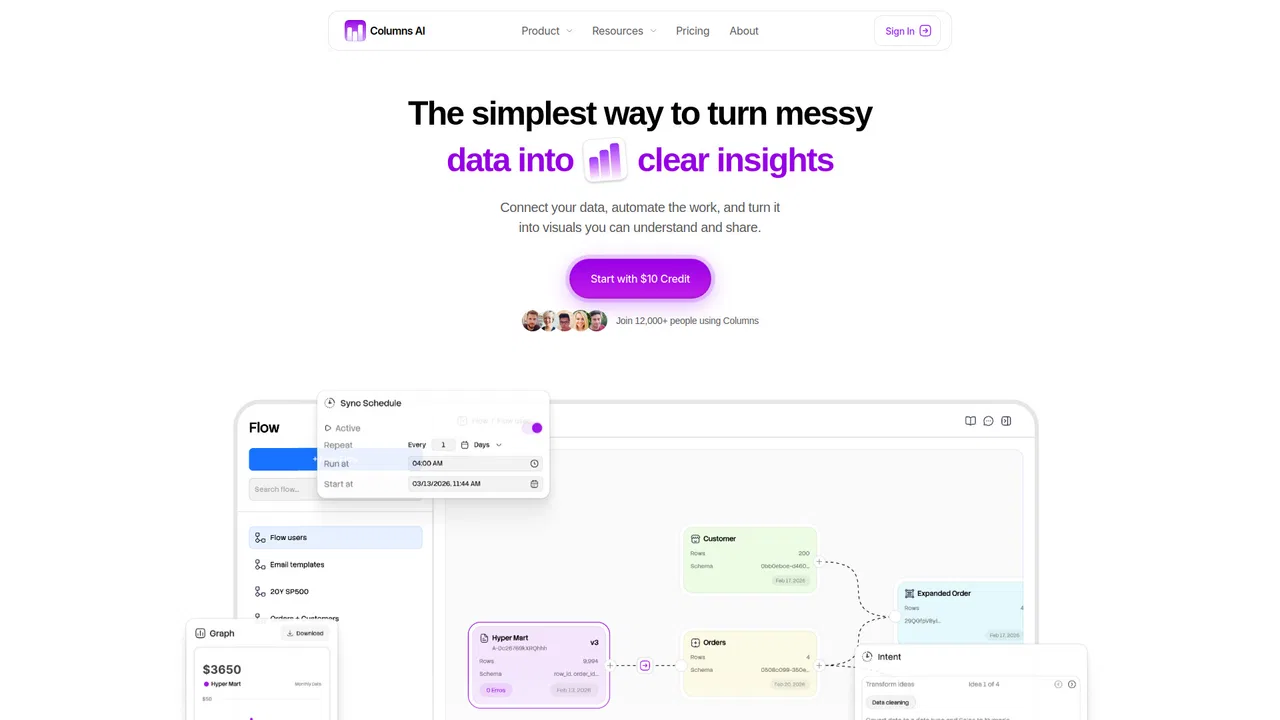
| 4 | Columns AI | 1.39K | -36.2% | 40% direct | Freemium, Paid | vs Columns AI |
| 5 | Formula Bot (Better Analyst) | 73.19K | -35.3% | 41% direct | Freemium | vs Formula Bot (Better Analyst) |
| 6 | Sourcetable — AI spreadsheet & data analyst | 38.5K | +13.2% | 34% direct | Freemium, Free Trial, Paid | vs Sourcetable — AI spreadsheet & data analyst |
SpecialistChat with your data to get analysis, charts, reports, and slides

SpecialistTurn messy data into beautiful, story-ready charts with AI

SpecialistChat with your data and get charts and diagrams in seconds

Clean, automate, and visualize your data in one platform

AI data analyst that turns plain-English questions into charts, dashboards and clean spreadsheets

SpecialistThe AI-native spreadsheet that talks to your databases

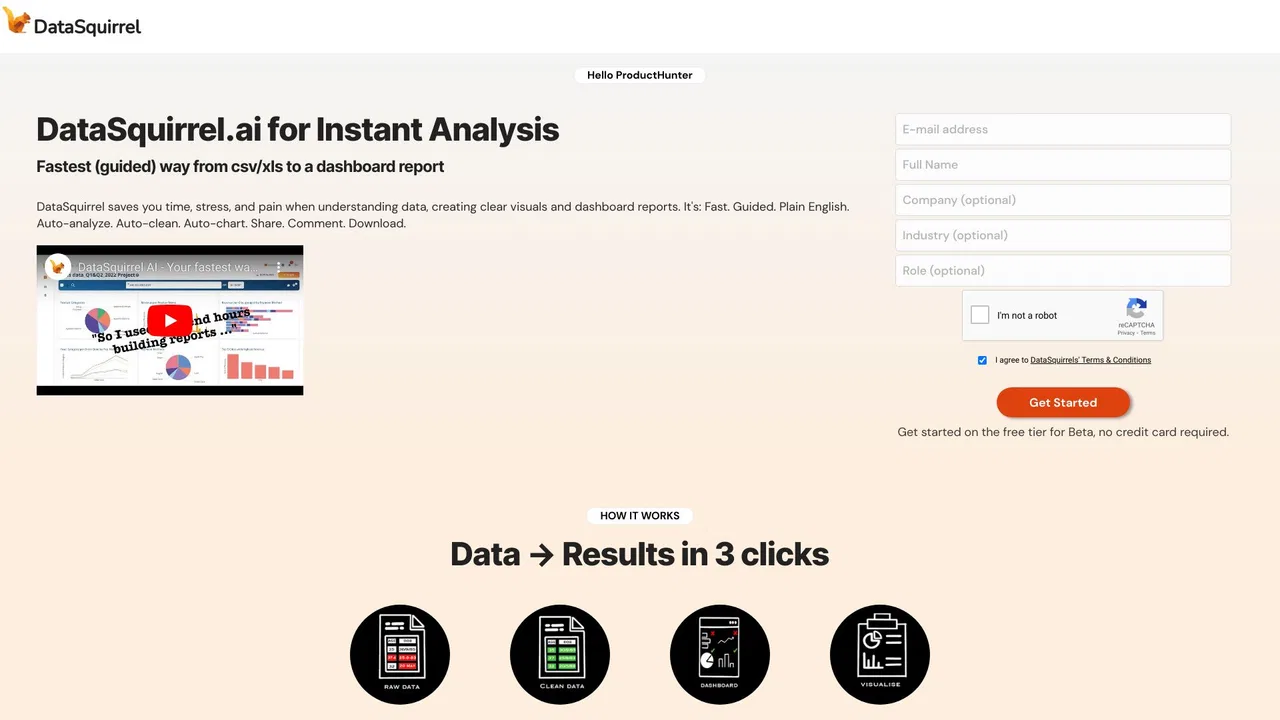
SpecialistSpreadsheet analysis in plain English, no formulas required

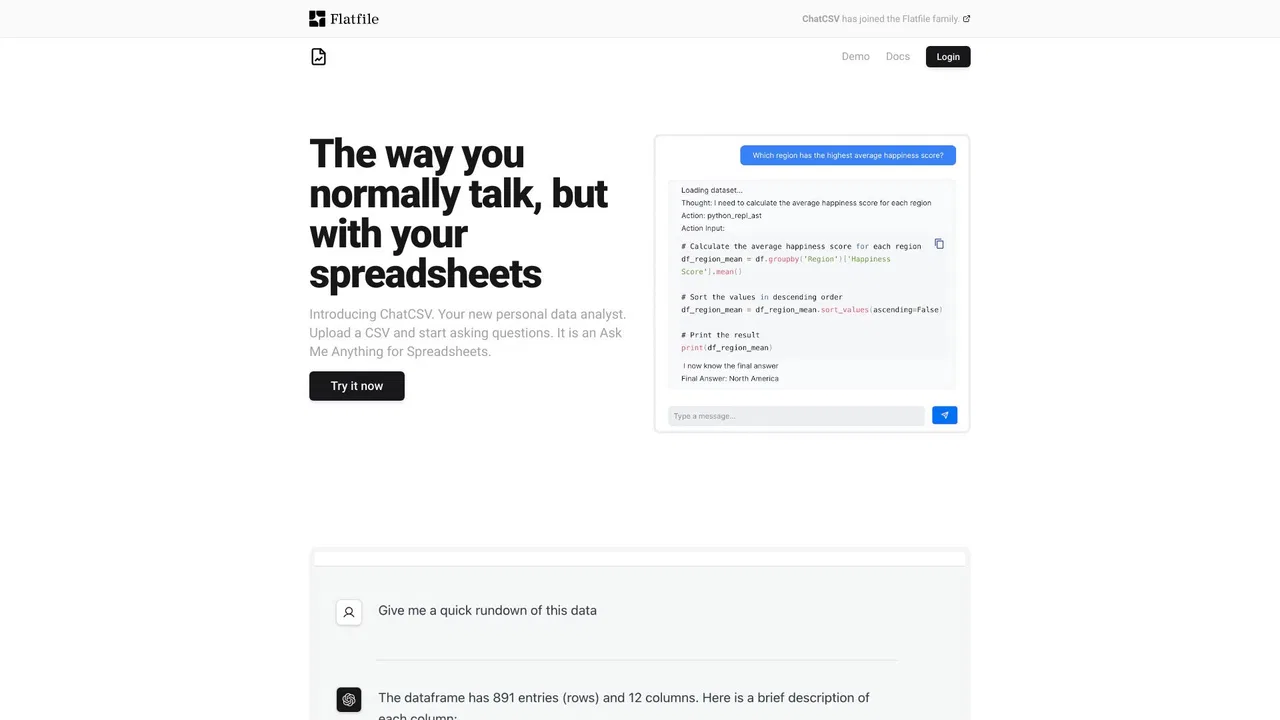
SpecialistAsk questions about your spreadsheets in plain language
SpecialistTurn text or data into interactive charts and diagrams with AI

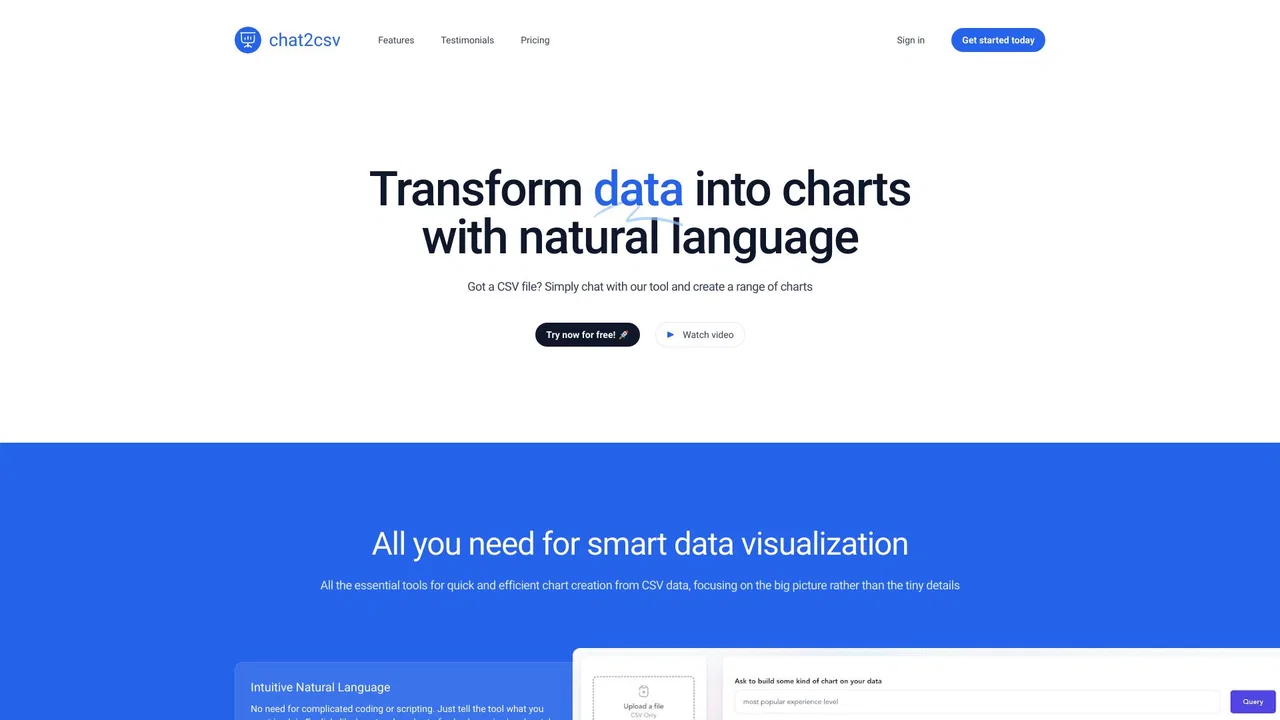
SpecialistTurn spreadsheets into charts by just asking in plain English

SpecialistAI data analytics for the spreadsheets you already have